Temporary reduction in daily global CO2 emissions during the COVID-19 forced confinement
Corinne Le Quéré, Robert B. Jackson, Matthew W. Jones, Adam J. P. Smith, Sam Abernethy, Robbie M. Andrew, Anthony J. De-Gol, David R. Willis, Yuli Shan, Josep G. Canadell, Pierre Friedlingstein, Felix Creutzig and Glen P. Peters
Read our article in Nature Climate Change (2020)
Update! Our updated assessment in March 2021 was published in a brief communication in Nature Climate Change (2021)
New! Visualise the impacts of COVID-19 confinement measures by country (credit @ajdegol)
Global Impacts of ‘Lockdown’
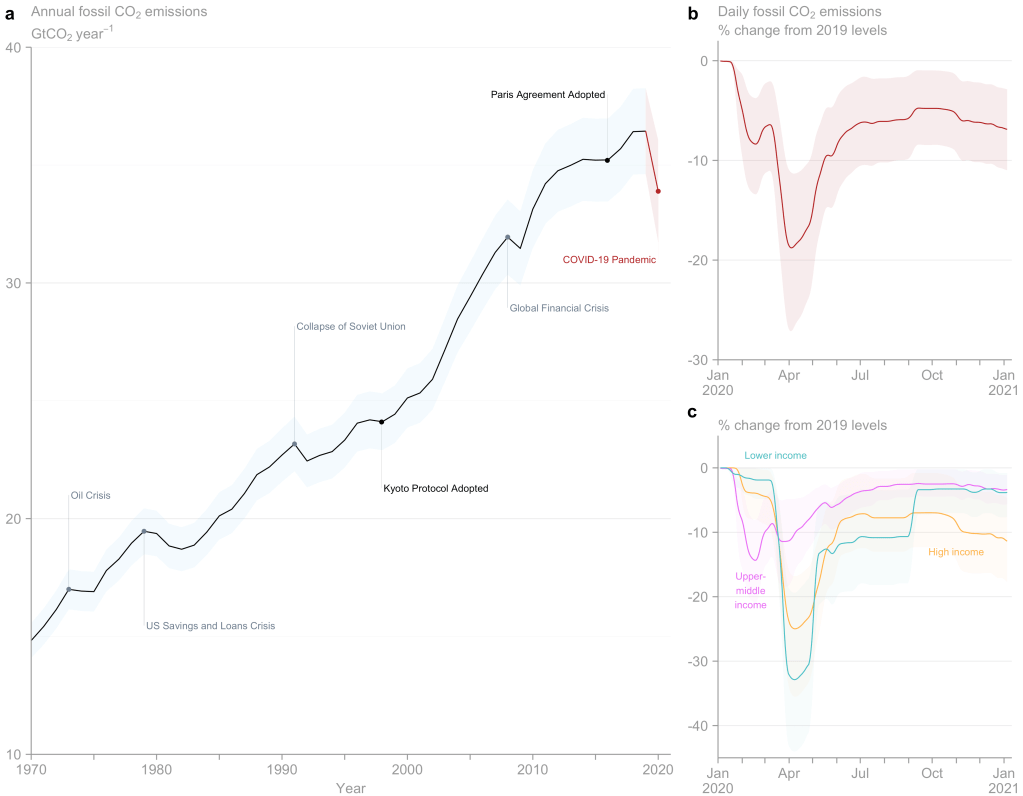
Global daily emissions fell sharply in 2020 as social confinement measures were introduced to slow the spread of coronavirus (COVID-19).
Regional Impacts
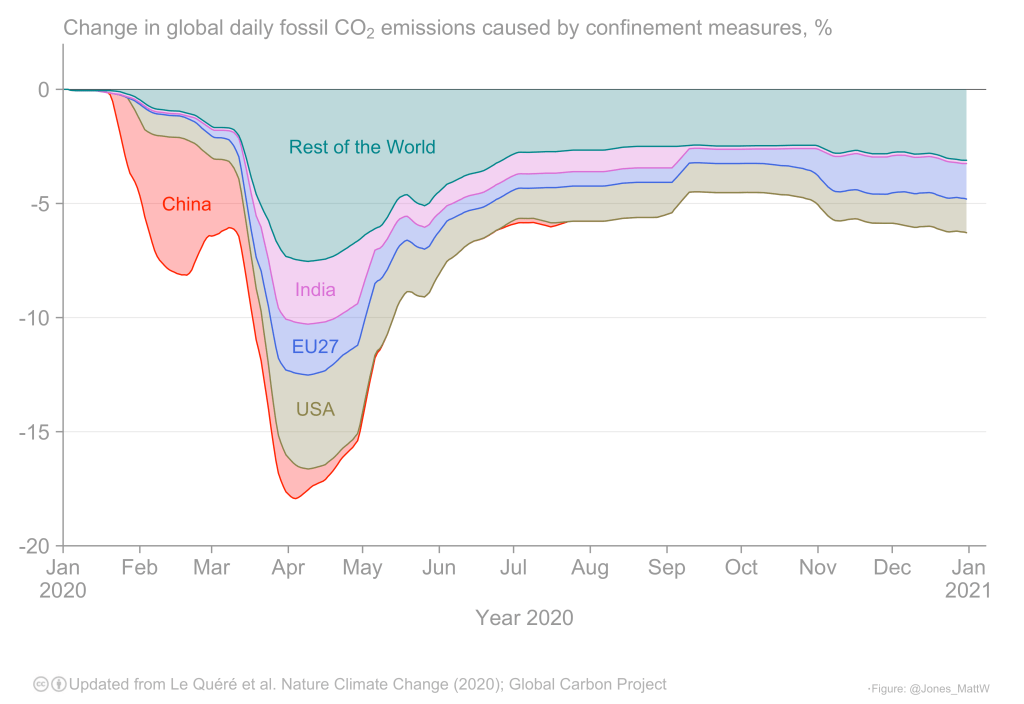
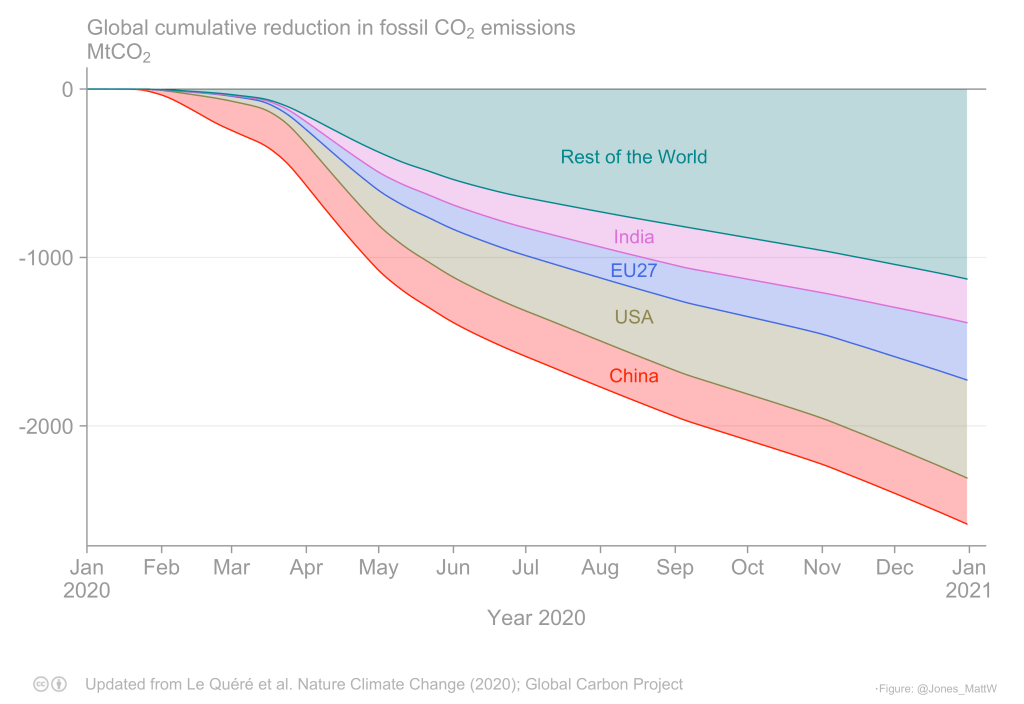
Reductions in emissions during January and February were predominantly driven by confinement in China.
International expansion of confinement measures led to deeper reductions in March and April.
Measures have persisted in many regions into 2021, with continued impacts on emissions.

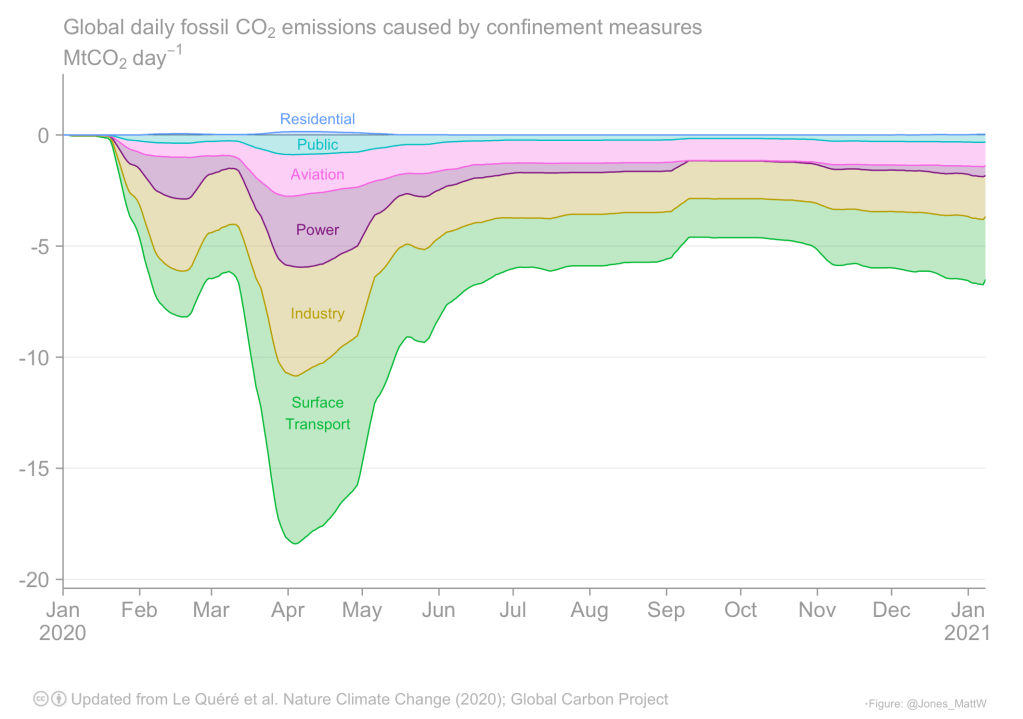
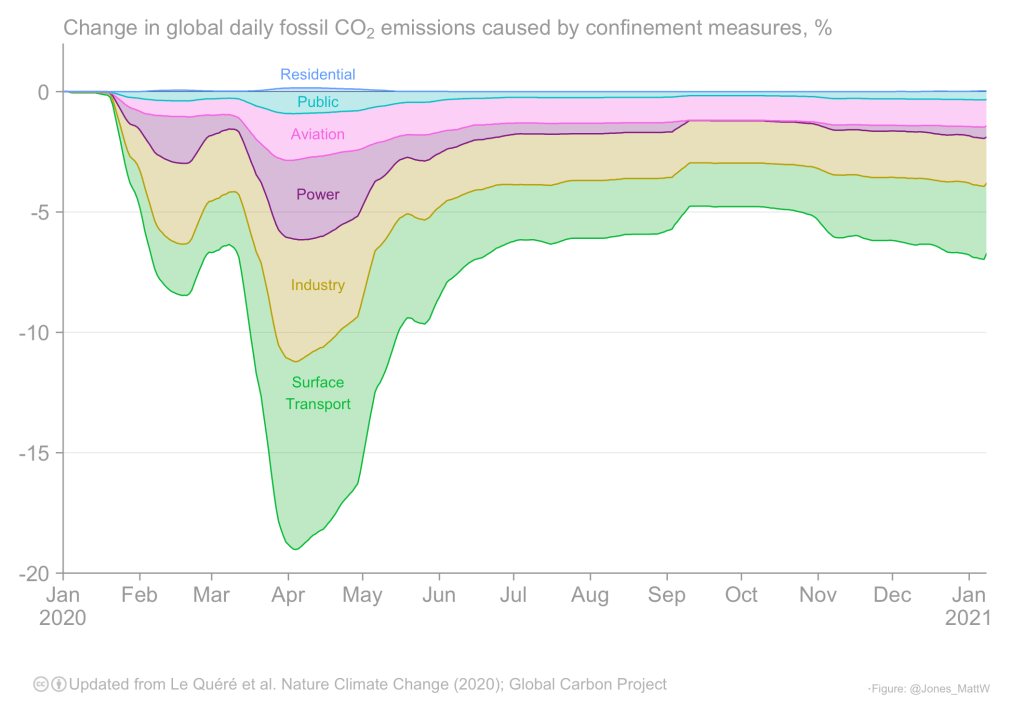
Global Impacts on Emission Sectors
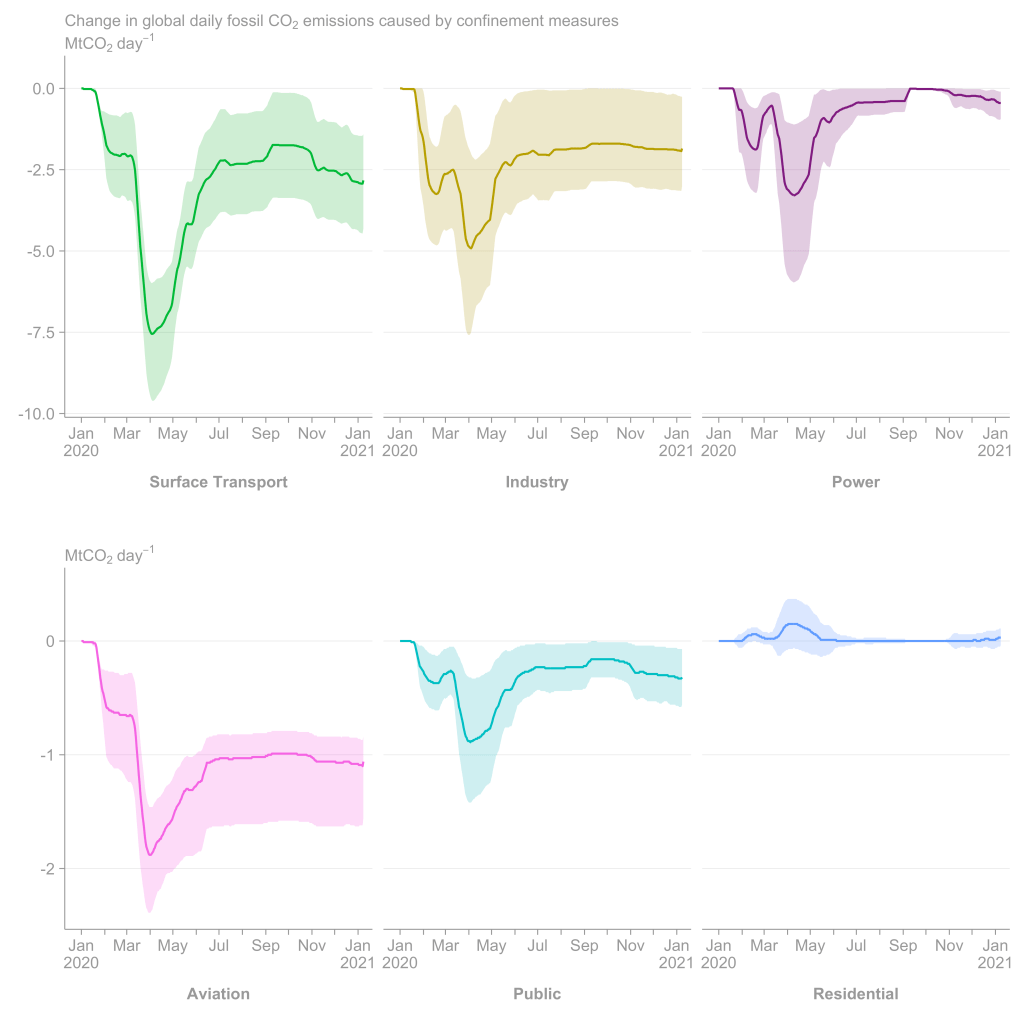
Reductions in emissions from surface transport, industry and power contributed most to the total reduction in daily emissions at the global scale.
Increases in residential emissions only slightly offset the reductions seen in other sectors.
Confinement had different impacts on total and sector-by-sector emissions reductions in different countries


You must be logged in to post a comment.